Flowmapper
Flowmapper collects and stores public transport data and can thus show what the accessibility of public transport looks like. Through this analysis platform, it is possible to streamline public transport, shorten travel time and reduce carbon dioxide emissions.
 Eva-Marie Wenehed
Flowmapper is developed within the company Tyréns innovation program and financed by Tyréns’ owner, Sven Tyrén’s foundation. Eva-Marie Wenehed, traffic planner and product owner of Flowmapper at Tyréns, was involved in the entire process until the service was launched in the Autumn of 2020. She says that the idea for the tool was born out of frustration at how difficult it was to find information about how the traffic system works, while knowing that it exists different types of digital imprints that should be able to provide that information.
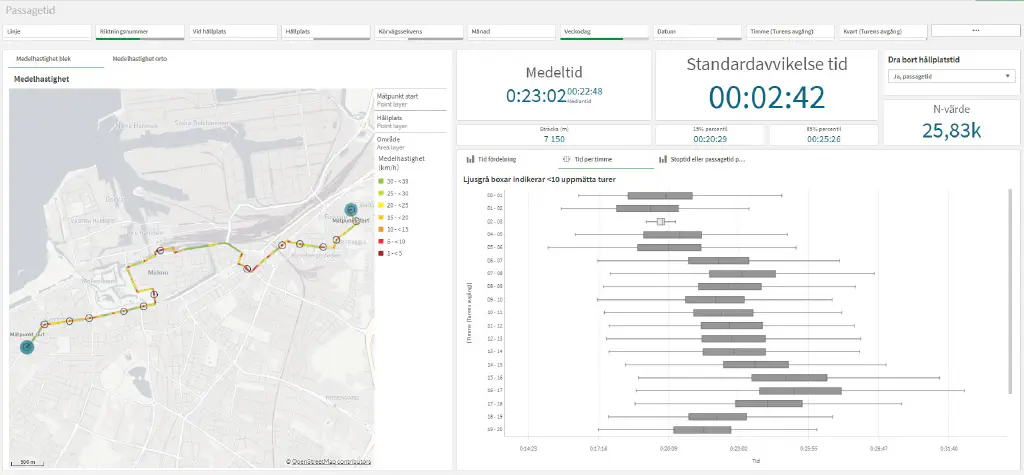
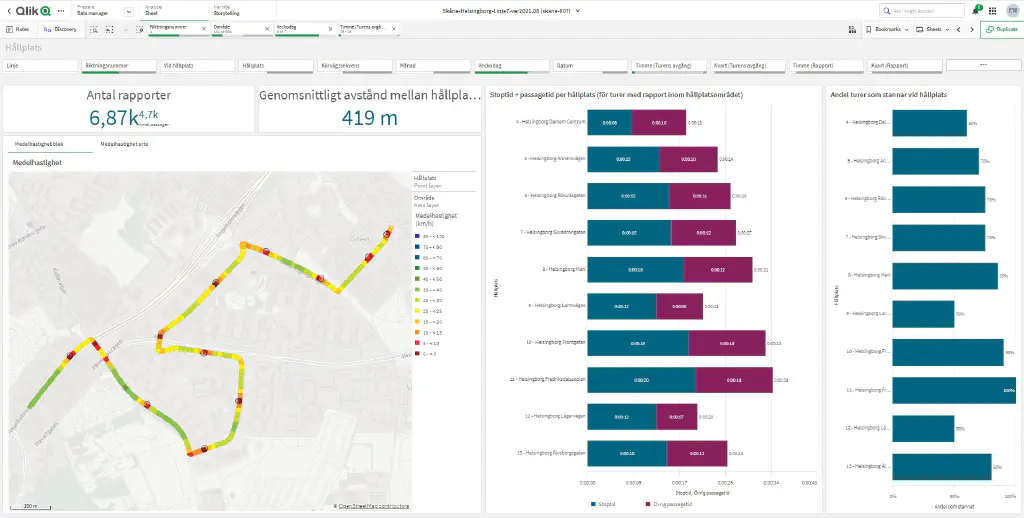
The platform is developed to easily show various aspects of accessibility, such as average speed, proportion of slow-moving vehicles or spread of driving time. The statistics are visualized on 25-meter distances, which provide unique accuracy. Since Flowmapper continuously collects and stores data, it is possible to also study changes over time.
Above all, Flowmapper offers an opportunity to quantify various accessibility problems. This gives an important basis to implement the measures that have the greatest effect at the lowest cost.
All data is retrieved from Trafiklabs APIs. Flowmapper uses the position data that buses, trams and trains in public transport transmit, which is available at Trafiklab in terms of GTFS data.
“Trafiklab is a great platform that makes it easy to get the data we need. Open and standardized data from both authorities and other organizations is a prerequisite for innovation. In that respect, we really think that Trafiklab is a role model,” says Eva-Marie. She adds that it would be great to have vehicle positions for all public transport authorities, and it would also be very interesting with more occupancy rate data.
Flowmapper is for everyone working to improve the accessibility of public transport. The customers are public transport companies, transport authorities and municipalities, i.e., partly those operators who deliver real-time data to Samtrafiken, which is the company behind Trafiklab. The users are primarily traffic planners.
Skånetrafiken has been using Flowmapper since the start in 2020. According to Hanna Larsson, who works with accessibility and infrastructure issues for bus operations, it is a very good analysis tool for studying for example average speeds and how driving times vary around the clock for a specific route or intersection.
Eva-Marie sees several development areas for Flowmapper. The ambition is to make it a complete tool for public transport planning. “We are also looking into how to expand geographically, to more countries than Sweden. But it’s all about access to data”.
FACTS ABOUT FLOWMAPPER
Release year: 2020
Type of service: An analysis platform for visualizing the accessibility of public transport. Flowmapper combines
illustrative maps with graphs that show statistics. There are several different views that show different aspects of
accessibility and travel times.
Data from Trafiklab: GTFS (position data)
Number of users: About 60 - including existing and test customers.